Telescope — GSM Tower Asset Management System
8,000+ towers, 150,000+ antennas across the network. Operators constantly replace, remove, and add antennas. The single source of truth for any tower's state is the tower itself. Towers are surveyed several times a year, photographed from multiple angles and positions. These photos are the raw data that must be processed to derive the real state of the network assets.
Create automatic system of accounting of antennas over all towers
- ML Vision
- Web
- ERP
- B2B
The client managed all asset records in spreadsheets. While the primary goal was to determine which antennas are mounted on each tower and build a system for keeping that data current, getting there first required migrating the entire process into a unified platform. We built the ML Vision pipeline and the management system in parallel. Let's start with the interesting part.
ML Workflow
1. Init — Raw tower photo sets are collected, normalized, and annotated to form the training dataset. The detection model is trained and iteratively fine-tuned until it reliably identifies antennas across varied lighting conditions, camera angles, and tower configurations.
2. CV Processing — Each uploaded photo is preprocessed: exposure and white-balance normalisation, lens distortion correction, and feature extraction. Overlapping images are aligned using EXIF orientation metadata and visual keypoints, preparing a clean, consistent input set for the detection stage.
3. Coarse Detection — Each image is scanned to locate antenna objects. The model outputs a bounding box and antenna type class for every detected element, establishing the basic inventory for a single image before any deeper analysis.
4. Segmentation — Each coarsely detected region is passed through an instance segmentation model that produces a pixel-precise mask for the antenna and its mounting bracket. Segmentation boundaries provide the exact outlines needed for accurate size estimation and help separate closely spaced antennas that bounding boxes would overlap.
5. Fine-grained Detection — Each detected antenna is analysed in depth: orientation direction is estimated, individual structural parts are segmented, and the antenna model is classified where possible. This produces a rich descriptor that feeds directly into size estimation and layout reasoning.
6. Detection Processing — Detections from all images of a single revision are aggregated. Approximate physical dimensions are calculated from known reference objects. Duplicate detections — the same antenna captured from different angles — are identified and merged into one canonical antenna record.
7. Tower Layout — Antenna records are assembled into a coherent spatial tower layout. Image metadata — GPS position, compass heading, and elevation — establishes the spatial frame, while known antenna model dimensions refine placement accuracy, producing a structured map of every antenna on the tower.
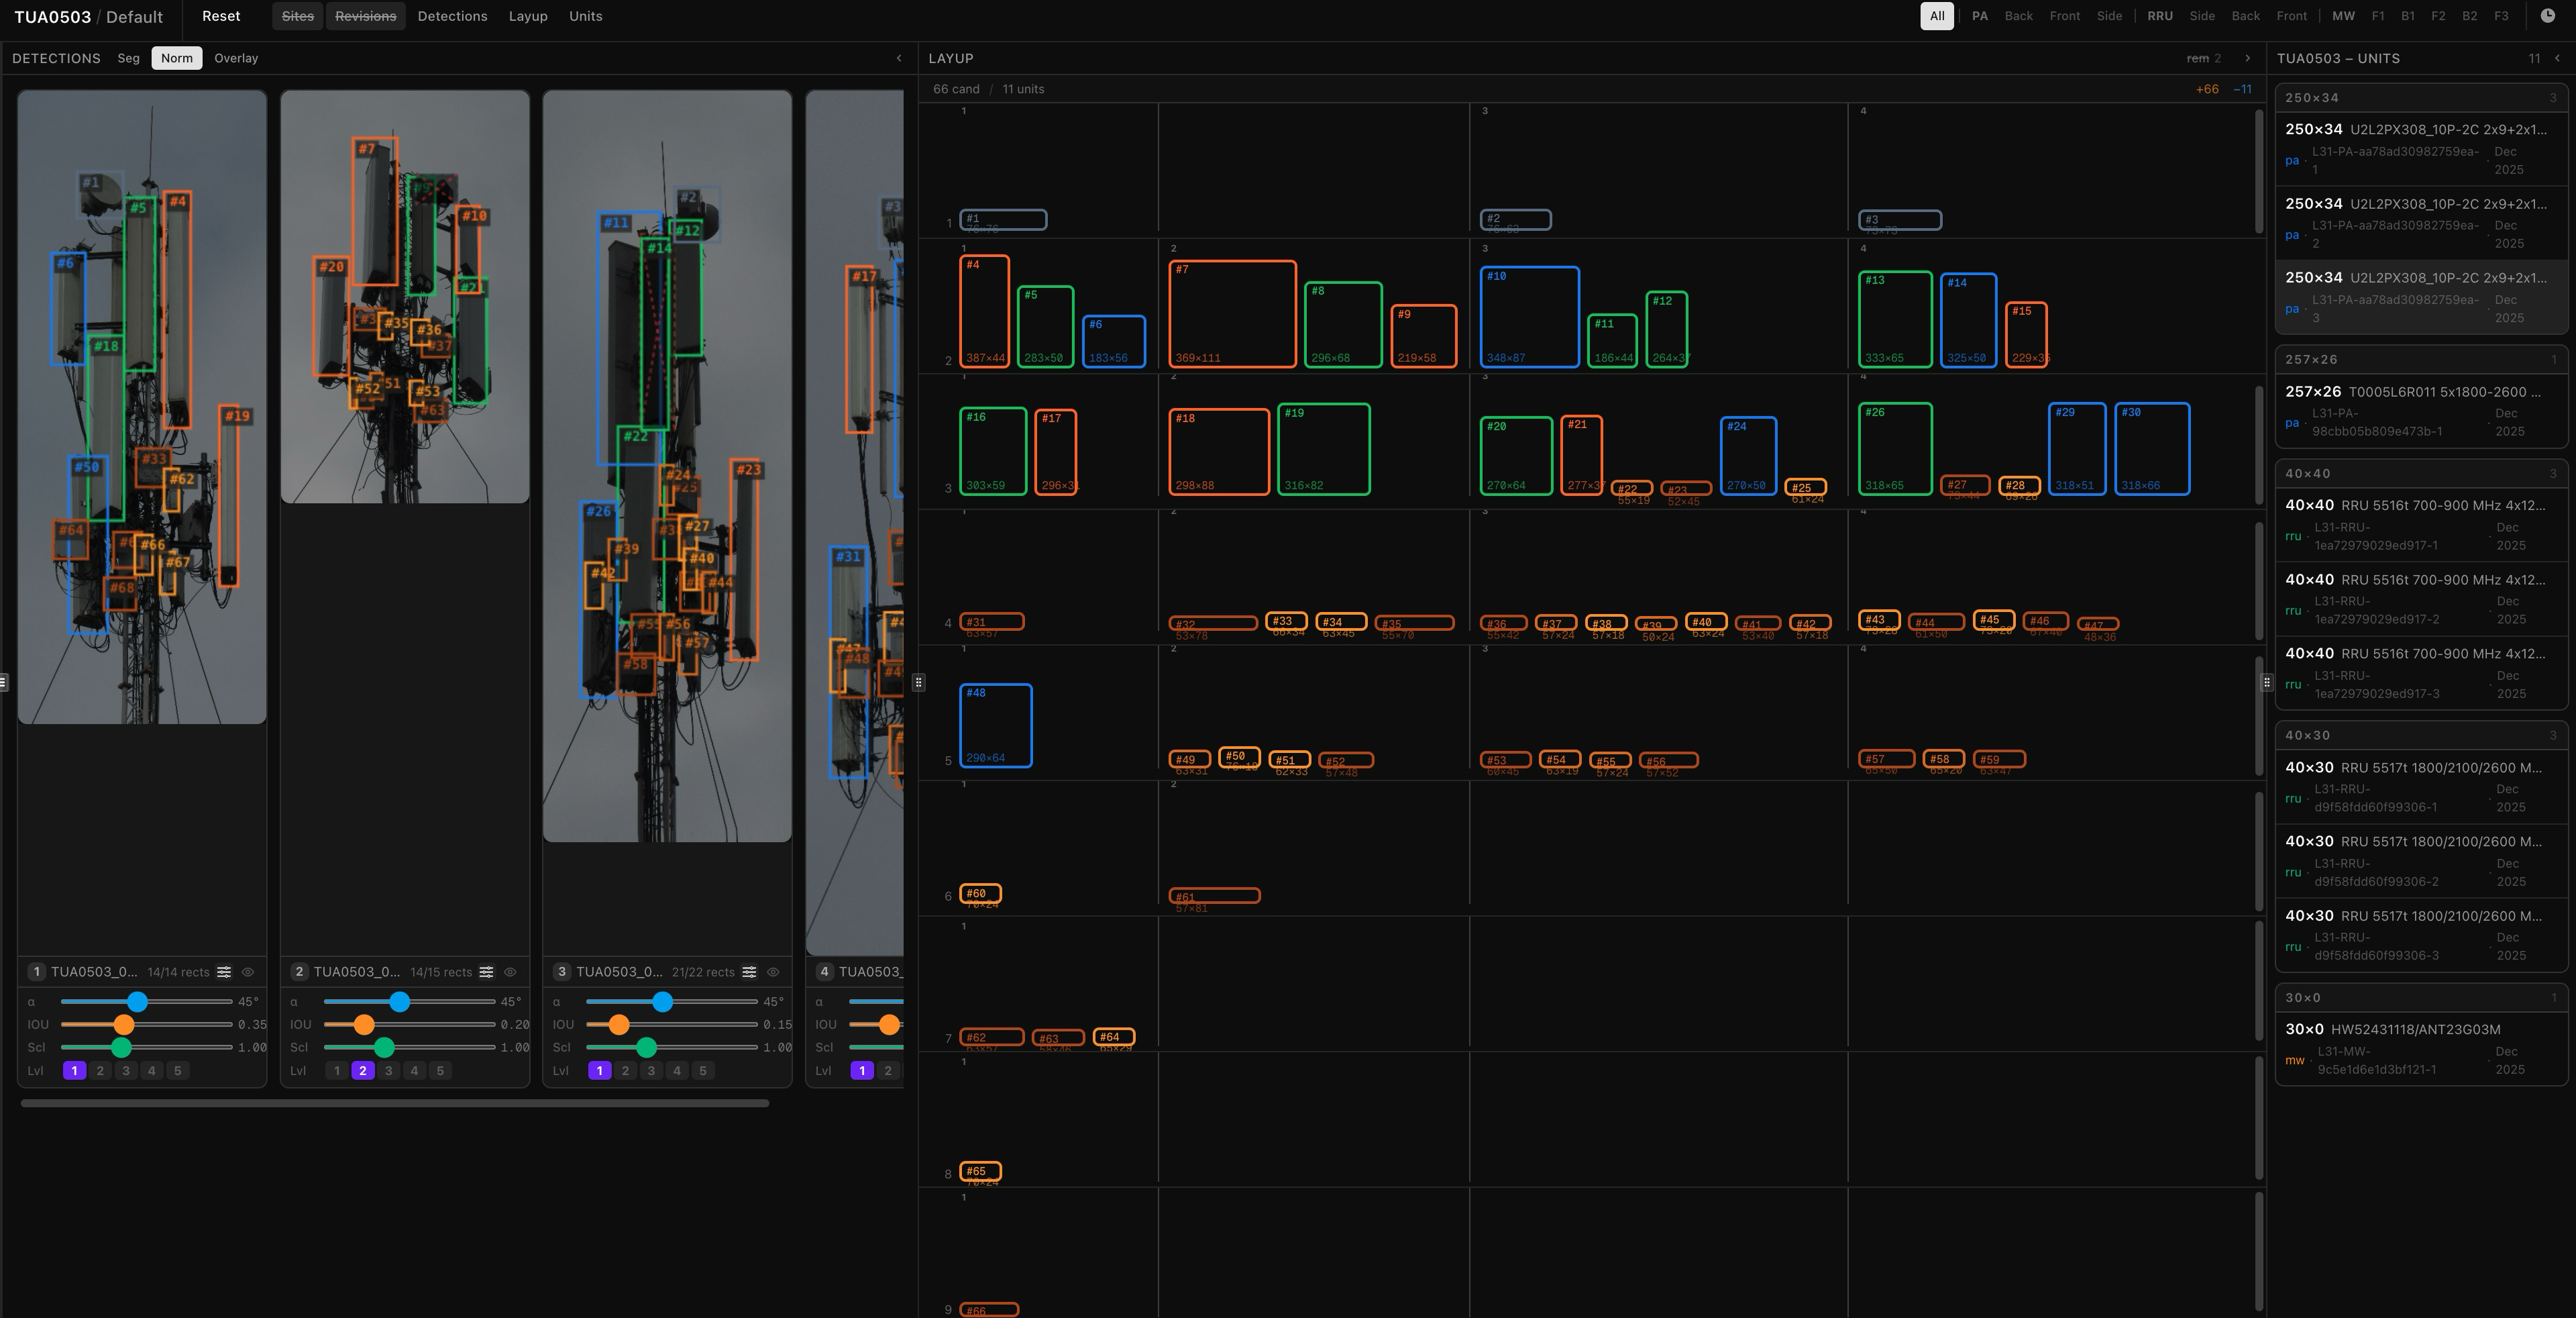
8. Tower Passport — All processed data is compiled into a structured Tower Passport — a machine-readable record containing the complete antenna inventory, physical characteristics, placement on the tower, and revision metadata. This document becomes the single source of truth for the tower's current state.
Web App Workflow
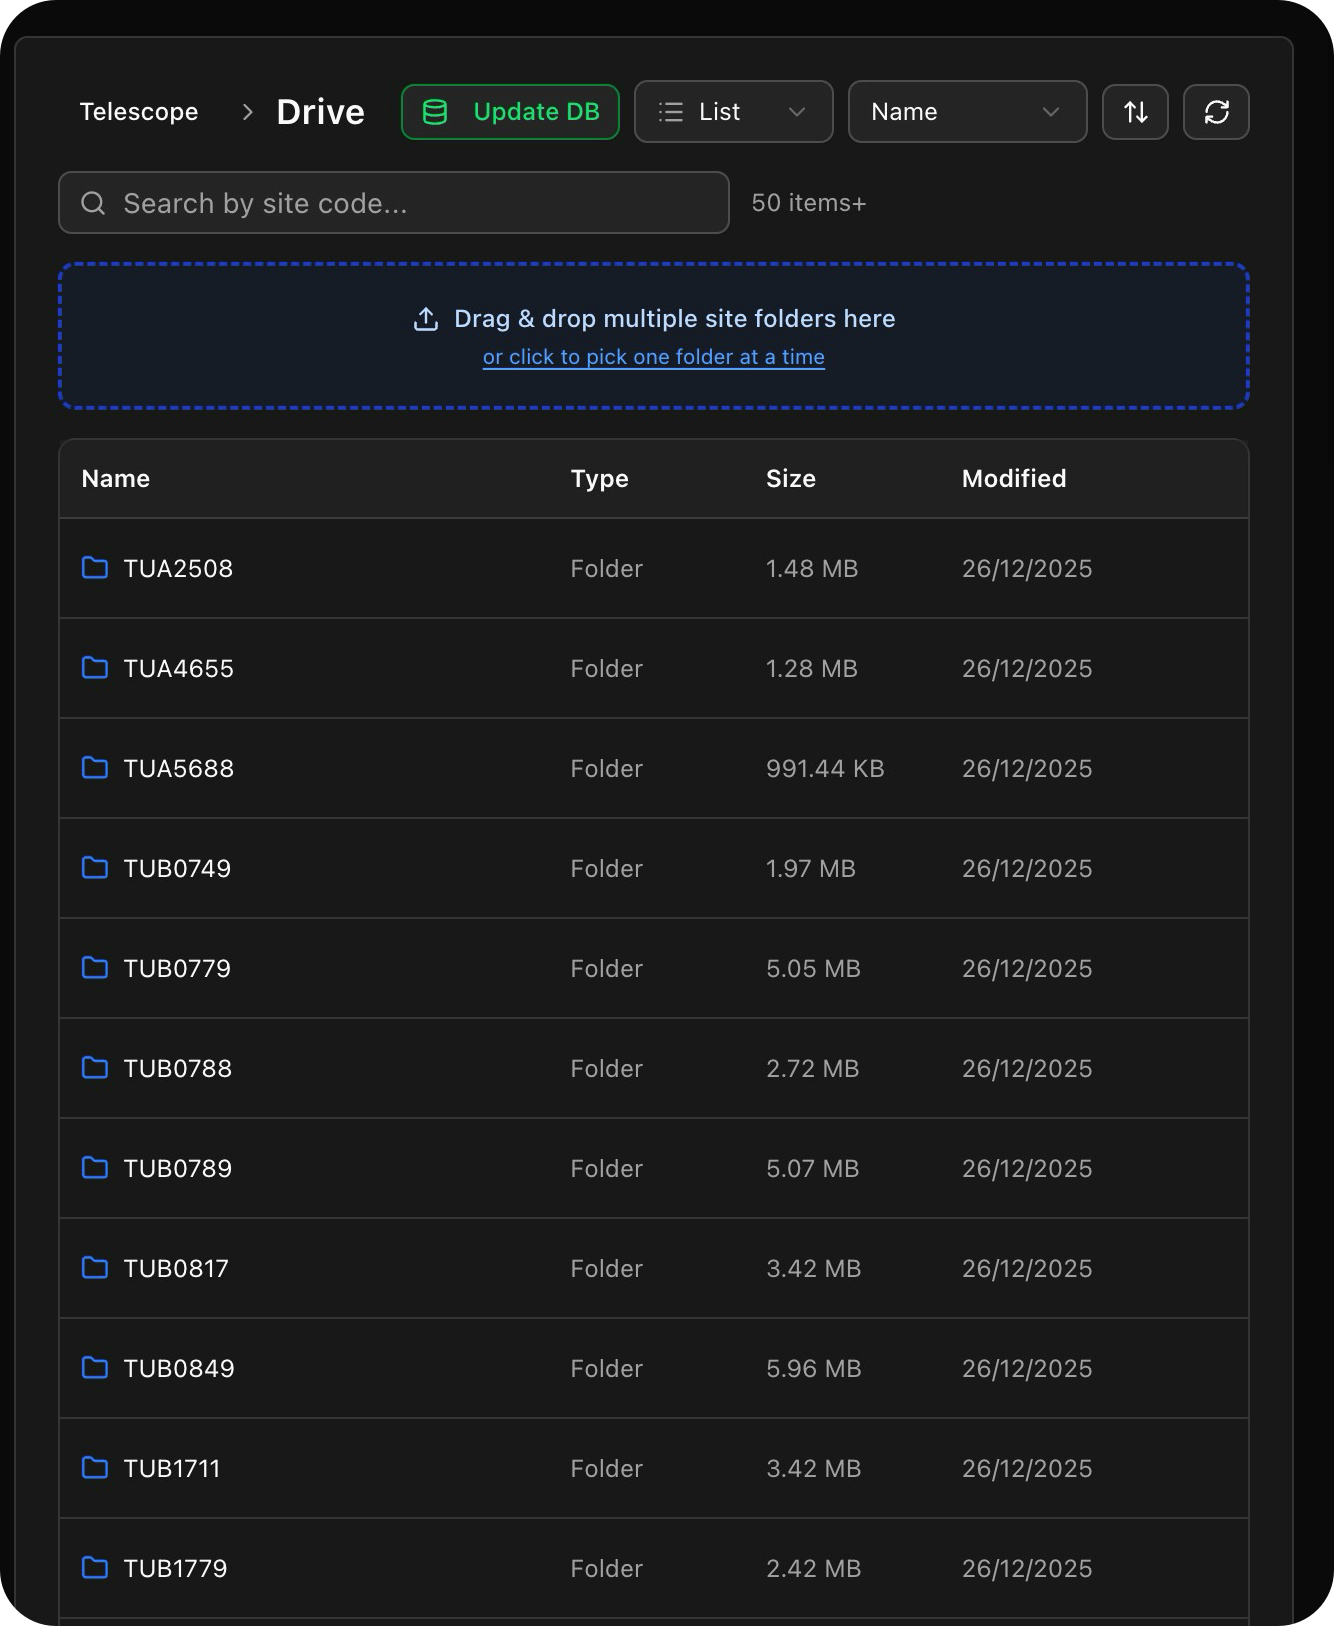
1. Upload Revision — A new revision is created by uploading the photo set captured during a tower survey together with revision metadata — date, surveyor, location, and field notes. The platform stores the raw images and registers the revision against the tower record.
2. Run ML Workflow — The uploaded photo set is queued and processed asynchronously through the ML pipeline. Progress is tracked per stage and surfaced in the UI, so operators know when results are ready without polling or waiting at the screen.
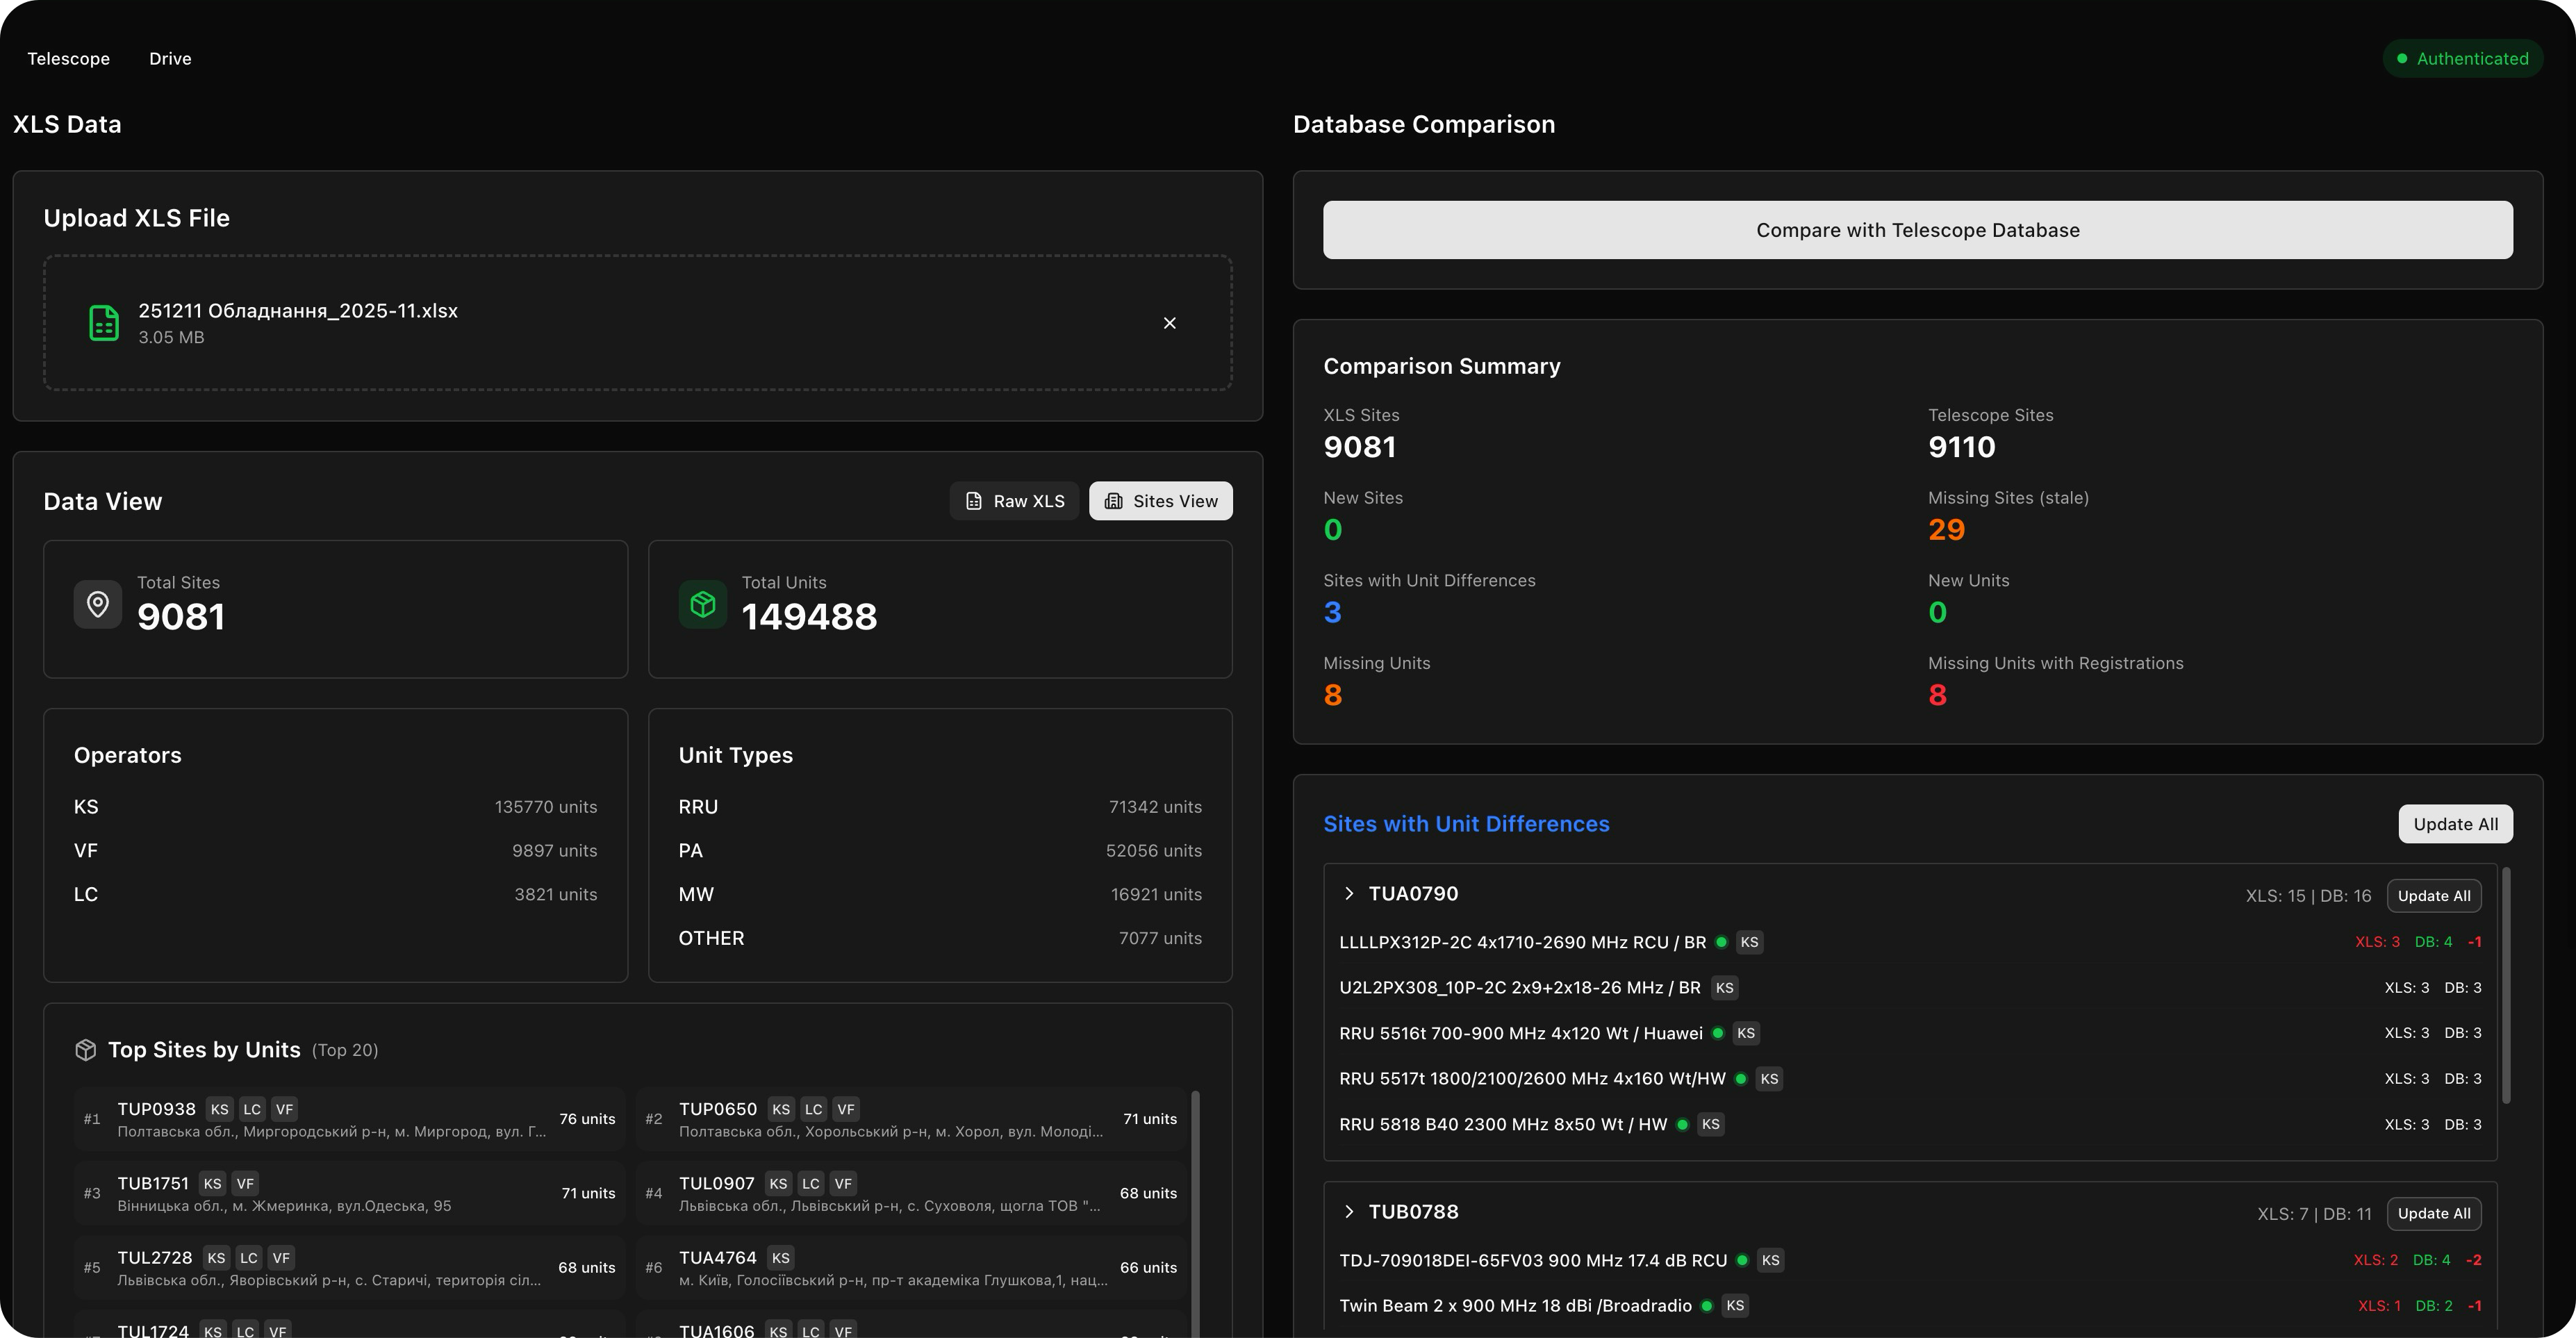
3. Compare Passports — The newly generated Tower Passport is automatically diffed against the previous revision. Added, removed, and changed antennas are highlighted side by side, giving operators an immediate picture of what changed on the tower since the last survey.
4. Update State — Operators review the detected changes and either approve them, reject false positives, or enter manual corrections. This step ensures the Tower Passport reflects reality rather than raw ML output, and builds ground truth data for future model improvements.
5. Generate Report — A structured report is generated summarising all asset changes for the revision — antennas added, removed, replaced, and unchanged — along with their specifications. The report can be exported for client delivery, regulatory filing, or archiving.
6. Dashboard — The dashboard provides a live view of the entire tower network — total antenna count, revision coverage, and asset state broken down by tower, region, or client. Operators can filter and drill down to identify towers overdue for revision or with pending change approvals.
Project state
Telescope is in active use by the client:
- Deployment, CI/CD
- Data and document flow integration
- Revision uploading
- Tower layout and comparison: Basic
- Tower layout and comparison: Advanced
- Tower layout and comparison: Automatic
- Integration with billing system